Welcome to DU!
The truly grassroots left-of-center political community where regular people, not algorithms, drive the discussions and set the standards.
Join the community:
Create a free account
Support DU (and get rid of ads!):
Become a Star Member
Latest Breaking News
Editorials & Other Articles
General Discussion
The DU Lounge
All Forums
Issue Forums
Culture Forums
Alliance Forums
Region Forums
Support Forums
Help & Search
S&P500 closed Wednesday 1/21 at 6876, up 1.2%, recovers half of yesterday's loss # TACO Trump ❤️Europe [View all]
This discussion thread is pinned.
Last edited Wed Jan 21, 2026, 08:34 PM - Edit history (240)
In the future I will only be doing these twice a week: Tuesday and Friday, unless it's really interesting.10 Year TREASURY YIELD 4.25% on 1/21 down 0.05 for the day, still up 0.08 since Thursday (ugh). It was 4.19% on Friday 12/12 (It local-bottomed out at 3.95% 10/22/25, its lowest point since April.)
https://finance.yahoo.com/quote/%5ETNX/
10 Year Treasury price: https://finance.yahoo.com/quote/ZN%3DF/
Bitcoin: $89,809 @ 730p ET, about same where it was yesterday. It was $95,401 @ 533p ET 1/16/26, It recently exceeded at last it's end of year 2024 closing level, but it's back below the waterline on that metric, , It's in bear market territory, down more than 20% from it's $126,000+ all-time high in October (20% down from $126,000 is $100,800) (Cryptocurrencies trade 24/7) https://finance.yahoo.com/quote/BTC-USD/
Next Fed rate decision: January 28
CME FedWatch tool (probabilities of various Fed interest rate moves) 1/20: 5.0% chance of a rate cut)
. . . https://www.cmegroup.com/markets/interest-rates/cme-fedwatch-tool.html
Coming up: THURSDAY(22nd)
# PCE.INFLATION (Federal Reserve's favorite inflation gauge),
# Personal Income,
# GDP Q3 Take2,
# Unemployment Insurance Claims
FRIDAY(23rd):
# Consumer sentiment final,
# S&P Flash Services & Manufacturing PMI's
Market news of the day: https://finance.yahoo.com/
How to find the latest Yahoo Finance "stock market today" report if it's not at the finance.yahoo page (note that the headline displayed there does not include the "Stock Market Today" words, but the article itself does): click on
https://www.google.com/search?q=%22stock+market+today%22+site%3Afinance.yahoo.com&oq=%22stock+market+today%22+site%3Afinance.yahoo.com
If the link doesn't work for you,
Google: "stock market today" site:finance.yahoo.com
Stock market today: Dow, S&P 500, Nasdaq futures climb after Trump's Greenland whiplash, Yahoo Finance, 1/21/26
Markets surged during Wednesday’s regular trading session after Trump signaled a pause on planned tariffs targeting Europe and suggested progress toward a diplomatic agreement involving Greenland. The comments helped soothe investor concerns that had weighed on stocks earlier in the week.
In a post on Truth Social, Trump said he and NATO Secretary General Mark Rutte had established a "framework" for a future deal related to Greenland. "I will not be imposing the Tariffs that were scheduled to go into effect on February 1st," the president said, after he threatened to impose a minimum of 10% tariffs on European countries that did not endorse a US purchase of Greenland.
Stocks started moving higher following those remarks, and the rally accelerated into the close. The Dow (^DJI), S&P 500 (^GSPC), and Nasdaq Composite (^IXIC) all surged over 1%, with the latter two major indexes posting their best days of 2026. Despite Wednesday’s rebound, the major indexes remain lower for the week.
Looking to the rest of the week, investors are bracing for a busy stretch of earnings and economic data. Intel (INTC), Procter & Gamble (PG), and GE Aerospace (GE) are set to report results Thursday. Expectations are sky-high for Q4 results, with Bloomberg reporting that beating estimates has been having the lowest impact to stock price on record. Weekly jobless claims data is also due before the opening bell.
------ SCROLLING DOWN THE PAGE -------------------
US stocks recover half of the prior day's plunge after Trump calls off Greenland-related tariffs
... and that he would not use force
------ OTHER ARTICLES ----------
US construction spending rebounds in October amid renovations (Commerce Dept), Reuters, 1/21/26
https://finance.yahoo.com/news/us-construction-spending-rebounds-october-153254973.html
Pending home sales - US pending home sales plunge to five-month low in December, Reuters, 1/21/26
https://www.reuters.com/business/us-pending-home-sales-slump-five-month-low-december-2026-01-21/
Pending home sales index tumbles 9.3%, reverse gains notched since late summer
Spending on new single-family housing projects slumps 1.3% in October
Global Stocks Trounce the S&P 500 in Trump’s Chaotic First Year, Bloomberg, 1/20/26
https://finance.yahoo.com/news/global-stocks-trounce-p-500-131530108.html
In fact, equities worldwide — once the US is excluded — have risen around 30% since he took office a year ago, roughly double the S&P 500’s gain, according to MSCI’s index. The US hasn’t lagged that much during a president’s first year since 1993, when the nation was recovering from a recession and investors were flocking to growing markets overseas.
Trump’s comparison with his predecessors is no better: As far as the S&P 500 goes, the first-year gain under Trump clocks in as only the ninth best start to a term since World War II, according to CFRA. Ronald Reagan, George H.W. Bush, Bill Clinton, Barack Obama, Joe Biden — and even Trump during his first stint — all saw bigger gains.
US presidents, of course, don’t determine the direction of the stock market, as much as they take the blame or credit. But in Trump’s case, his trade war, foreign-policy surprises like pushing for a US takeover of Greenland, moves to exert greater control over key industries, and threat to the Federal Reserve’s independence have all periodically unnerved investors. That, in turn, has effectively tapped the brakes on a rally driven largely by the artificial-intelligence boom and the surprisingly resilient economy he inherited.
-snip-
[Also] MSCI’s emerging-market index rose over 30% last year, it’s biggest advance since 2017.
The S&P 500 gained 15.7% in Trump's first year, according to a table in the article, comparing the first year of all presidential terms since (and including) FDR.
================================
CALENDAR
Recent and Coming Up, Reports (I'm also keeping January 12 and later ones for now, I put the older ones in reply #1
https://www.marketwatch.com/economy-politics/calendar
See Reply #1 to this thread for reports prior to January 12
The government reports are all seasonally adjusted, as are most, if not all, of the non-government reports the media covers, so please don't post comments about how the numbers look good (or not as bad as expected) only because of Christmas season hires or Christmas shopping -- seasonal factors like that have been adjusted for
Monday Jan 12
# Nothing
Tuesday Jan 13
# CPI Consumer Price Index - The headline (all items) number was as expected: December (over November): +0.3%, Year-over-year: +2.7%
The Core measure (which excludes food and energy) was a 0.1 percentage points below expectations: December (over November): +0.2%, Year-over-year: 2.6%. Note that the one-month numbers when annualized (3.6% and 2.4%) are over the Fed's 2.0% target, as are both year-over-year numbers.
The actual numbers calculated from the index values for more accuracy:
All items CPI: December (over November): +0.307% (which annualizes to 3.75%),
Core CPI: December (over November): +0.239% (which annualizes to 2.91%),
LBN thread: https://www.democraticunderground.com/10143597741
# New home sales
# Budget deficit
# NFIB optimism index
Wednesday Jan 14
# Retail sales for November (delayed report) (KEEP IN MIND THESE ARE NOT INFLATION-ADJUSTED but they are seasonally adjusted)
Numbers are the increase over the previous month unless specified otherwise e.g. "12 months" which is the 12 month average aka year-over-year
Retail sales rose a better-than-expected 0.6% in November, and rose 3.3% in the past 12 months through November (while inflation thru November was 2.7%, so retail sales gained only 0.6% over the 12 months in inflation-adjusted dollars), AP, 1/14/26 == https://finance.yahoo.com/news/retail-sales-rose-better-expected-134204407.html
(The previous 2 months were pathetic: September was +0.1% (while inflation was +0.3%), October was -0.1% (there are no month-to-month inflation numbers for October or November; again all of these are seasonally adjusted numbers, but not inflation-adjusted),
The MahatmaKaneJeeves LBN Thread: Wholesale inflation was softer than expected, RETAIL SALES moved higher in November, 1/14/26 == https://www.democraticunderground.com/10143598490
. . . [] From the Source: https://www.census.gov/retail/index.html -> https://www.census.gov/retail/sales.html :
. . . [] Advance Retail Sales: Retail Trade and Food Services (MARTSMPCSM44X72USN), Not Seasonally Adjusted: -0.8% == https://fred.stlouisfed.org/series/MARTSMPCSM44X72USN
. . . [] Advance Retail Sales: Retail Trade and Food Services (MARTSMPCSM44X72USS), Seasonally Adjusted: +0.6% (September was +0.1%, October was -0.1%, ) == https://fred.stlouisfed.org/series/MARTSMPCSM44X72USS
. Very strange that in November, the seasonal adjustment process revised the November over October upward from -0.8% to +0.6%. October over September got seaonally revised downward from +4.9% to -0.1%
# PPI (Producer Price Index, aka Wholesale Prices) for November (delayed report)
Numbers are the increase over the previous month unless specified otherwise like "12 months" which is the 12 month average aka year-over-year
PPI for November +0.2% (Oct was +0.1%), 12 months: +3.0%
CORE PPI excluding food, energy and trade services: +0.2% (was +0.7% in October) 12 months: +3.5%, 1/14/26
Note that in November, for both the PPI and Core PPI, the 0.2% increase, when annualized is 2.4%, which exceeds the Fed's 2.0% target. And the year-over-year numbers (PPI: +3.0%, Core PPI: +3.5%) are well over the Fed's 2.0% target
. MahatmaKaneJeeves LBN Thread: Wholesale inflation was softer than expected, retail sales moved higher in November, 1/14/26 == https://www.democraticunderground.com/10143598490
. Ultimate Source: https://www.bls.gov/news.release/ppi.nr0.htm
# Existing home sales (delayed report)
Thursday Jan 15
# Unemployment insurance claims
. Initial Unemployment Insurance Claims - Week Ending January 10: 198,000, down 9,000.
. . Note: Not Seasonally Adjusted: 330,684, Seasonally Adjusted: 198,000, quite a big seasonal adjustment
. Continuing Claims (week ending Jan 3): 1,884,000, down 19,000, 1/15/26
https://www.dol.gov/sites/dolgov/files/OPA/newsreleases/ui-claims/20260098.pdf
. Reuters - good article, they say the low seasonally adjusted initial claims level might be dues to problem with seasonal adjustment. They also mention the NSA number above (330,684)
. . https://www.reuters.com/world/us/us-weekly-jobless-claims-unexpectedly-fall-amid-seasonal-adjustment-challenges-2026-01-15/
# Import prices
# Empire state and Philadelphia Fed's manufacturing surveys
Friday Jan 16
# Industrial production and capacity utilization - US manufacturing output unexpectedly increases in December, Reuters, 1/16/26
https://finance.yahoo.com/news/us-december-industrial-production-rises-142129670.html
MONDAY JAN 19 - Martin Luther King Jr. Day, None scheduled
TUESDAY JAN 20 - None scheduled
WEDNESDAY JAN 21
# Pending home sales US pending home sales plunge to five-month low in December, Reuters, 1/21/26
https://www.reuters.com/business/us-pending-home-sales-slump-five-month-low-december-2026-01-21/
Pending home sales index tumbles 9.3%, reverse gains notched since late summer
Spending on new single-family housing projects slumps 1.3% in October
THURSDAY JAN 22
# PCE inflation FOR NOVEMBER - the Fed's favorite inflation gauge. So the Fed will have this report before their January 28 rate decision, assuming no government shutdowns
# GDP Q3 (first revision) - expected to be 4.3% annualized rate, same as the initial estimate
# Personal spending and personal income for NOVEMBER
# Unemployment insurance claims
FRIDAY JAN 23
# Consumer sentiment (final) Jan.
# S&P flash U.S. services PMI Jan.
# S&P flash U.S. manufacturing PMI Jan.
The full calendar: https://www.marketwatch.com/economy-politics/calendar
Revised release dates for Bureau of Labor Statistics reports: https://www.bls.gov/bls/2025-lapse-revised-release-dates.htm
BEA.GOV news release schedule (they produce reports on the GDP, Retail Sales, PCE Inflation (the Fed's favorite inflation gauge), and Personal Consumption and Income: https://www.bea.gov/news/schedule
=============================================
The S&P 500 closed Wednesday January 21 at 6876, up 1.2% for the day,
and up 18.9% from the 5783 election day closing level,
and up 14.7% from the inauguration eve closing level,
and up 16.9% since the December 31, 2024 close
and up 0.4% Year-To-Date (since the December 31, 2025 close)
S&P 500
# Election day close (11/5/24) 5783
# Last close before inauguration day: (1/17/25): 5997
# 2024 year-end close (12/31/24): 5882
# Trump II era low point (going all the way back to election day Nov5): 4983 on April 8
# 2025 year-end close (12/31/25): 6845
# October 28 all-time-high: 6890.90, surpassed by December 24's all-time high of 6932.00
# Several market indexes: https://finance.yahoo.com/
# S&P 500: https://finance.yahoo.com/quote/%5EGSPC/
https://finance.yahoo.com/quote/%5EGSPC/history/
Bitcoin
Bitcoin ended 2024 at $93,429. https://finance.yahoo.com/quote/BTC-USD/
Bitcoin's all-time interday high: 126,198 on Oct. 6
Bitcoin's all-time closing high: 124,753 on Oct 6. (that's what Yahoo Finance shows, but cryptocurrencies trade 24/7)
https://finance.yahoo.com/quote/BTC-USD/history/
========================================================
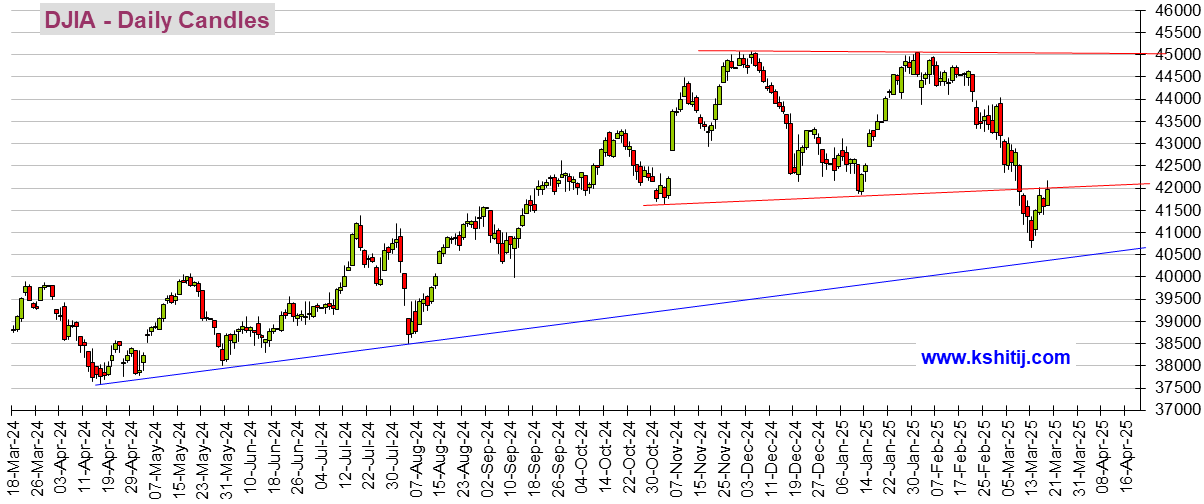
I'm not a fan of the DOW as it is a cherry-picked collection of just 30 stocks that are price-weighted, which is silly. It's as asinine as judging consumer price inflation by picking 30 blue chip consumer items, and weighting them according to their prices. But since there is an automatically updating embedded graphic, here it is. It takes several, like 6 hours, after the close for it to update, like about 10 PM EDT.
(If it still isn't updated, try right-clicking on it and opening in a new tab. #OR# click on https://finance.yahoo.com/quote/%5EDJI/ ).
The Dow closed Tuesday at 48,489, and it closed Wednesday at 49,077, a rise of 1.2% (589 points) for the day
https://finance.yahoo.com/
DOW: https://finance.yahoo.com/quote/%5EDJI/
. . . . . . https://finance.yahoo.com/quote/%5EDJI/history/
DOW
# Election day close (11/5/24) 42,222
# Last close before inauguration day: (1/17/25): 43,488
# 2024 year-end close (12/31/24): 42,544
# 2025 year-end close (12/31/25): 48,063
DJIA means Dow Jones Industrials Average. It takes about 6 hours after the close to update, so check it after 10 PM EDT. Sometimes it takes a couple days (sigh)

I don't have an embeddable graph for the S&P 500, unfortunately, but to see its graph, click on https://finance.yahoo.com/quote/%5EGSPC/
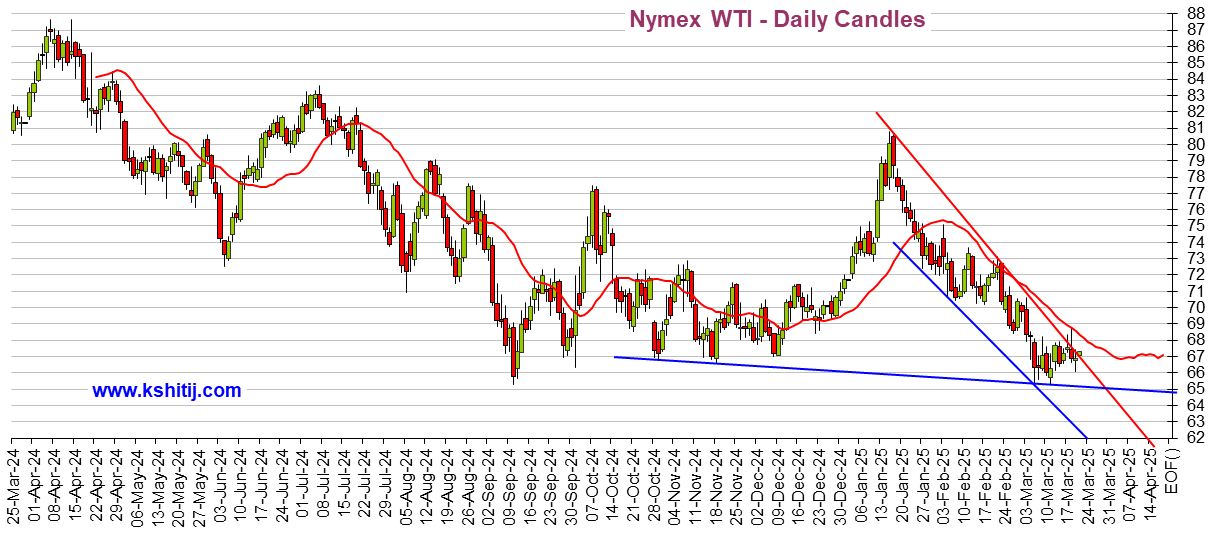
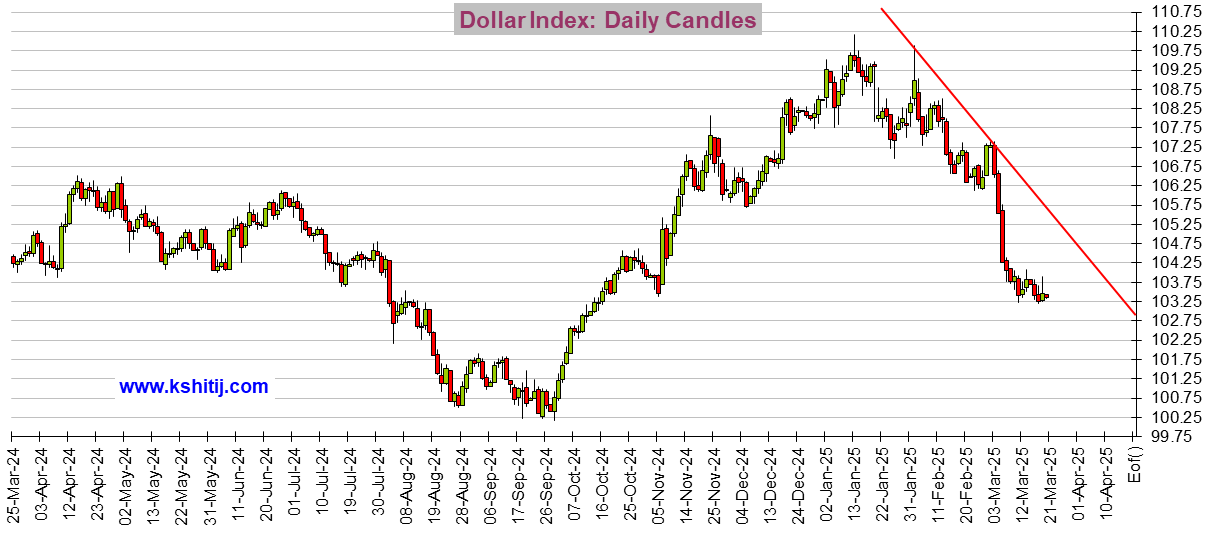
While I'm at it, I might as well show Oil and the Dollar:
Crude Oil

US Dollar Index (DX-Y.NYB)

If you see a tiny graphics square above and no graph, right click on the square and choose "load image". There should be a total of 3 graphs. And remember that it typically takes about 6 hours after the close before these graphs update.
🚨 ❤️ 😬! 😱 < - - emoticon library for future uses
19 replies
 = new reply since forum marked as read
Highlight:
NoneDon't highlight anything
5 newestHighlight 5 most recent replies
S&P500 closed Wednesday 1/21 at 6876, up 1.2%, recovers half of yesterday's loss # TACO Trump ❤️Europe [View all]
progree
Mar 2025
OP
Kicking: update for Thurs. March 6 close. The "Trump Trade" is back underwater after losing 1.8% for the day (S&P 500)
progree
Mar 2025
#2
Kicking: Update: S&P 500 closed Friday at 5770, up 0.5% for the day but still below the election day close
progree
Mar 2025
#3
Update: S&P 500 closed Monday 3/10 at 5615, down 2.7% for the day and 2.9% below the election day close
progree
Mar 2025
#4
Update: S&P 500 closed Tuesday 3/11 at 5572, down 0.8% for the day, briefly fell into correction territory
progree
Mar 2025
#5
S&P 500 closed Wednesday 3/12 at 5599, up 0.5% for the day, but down 3.2% since election day
progree
Mar 2025
#6
Update: S&P 500 closed Thursday at 5522, down 1.4% for the day, and MORE THAN 10% down from the all-time high
progree
Mar 2025
#7
Update: S&P 500 closed Friday at 5639, up 2.1% for the day, and down 2.5% since election day
progree
Mar 2025
#8
Update: S&P 500 closed Monday at 5675, up 0.6% for the day, and down 1.9% since election day
progree
Mar 2025
#9
Update: S&P 500 closed Tuesday at 5615, down 1.1% for the day, and down 2.9% since election day
progree
Mar 2025
#10
S&P 500 closed Tuesday 3/25 at 5777, up 0.2% for the day, down 0.1% since election day, down 6.0% from ATH
progree
Mar 2025
#11